NDVI Static Images
The following code is adapted from a Google Earth Engine JavaScript tutorial. The code was translated into python, made static, and reproduced with several color palettes. The python code is found on the CropMOSAIKS GitHub.
import ee
from IPython.display import Imageee.Initialize()ndvi = ee.ImageCollection('MODIS/006/MOD13A2').select('NDVI')mask = ee.FeatureCollection('USDOS/LSIB_SIMPLE/2017').filter(ee.Filter.eq('wld_rgn', 'Africa'))region = ee.Geometry.Polygon(
[
[
[-19.698368046353494, 38.1446395611524],
[-19.698368046353494, -36.16300755581617],
[53.229366328646506, -36.16300755581617],
[53.229366328646506, 38.1446395611524]
]
]
)ndvi = ndvi.filterDate('2013-01-01', '2014-01-01')ndvi = ndvi.reduce(ee.Reducer.median())ndvi = ndvi.clip(mask)natural = [
'FFFFFF', 'CE7E45', 'DF923D', 'F1B555', 'FCD163', '99B718', '74A901',
'66A000', '529400', '3E8601', '207401', '056201', '004C00', '023B01',
'012E01', '011D01', '011301'
]
viridis = [
"#440154FF", "#48186AFF", "#472D7BFF", "#424086FF", "#3B528BFF", "#33638DFF",
"#2C728EFF", "#26828EFF", "#21908CFF", "#1F9F88FF", "#27AD81FF", "#3EBC74FF",
"#5DC863FF", "#82D34DFF", "#AADC32FF", "#D5E21AFF", "#FDE725FF"
]
magma = [
"#000004FF", "#0B0724FF", "#210C4AFF", "#3D0965FF", "#56106EFF", "#71196EFF",
"#89226AFF", "#A32C61FF", "#BB3754FF", "#D14545FF", "#E35932FF", "#F1721EFF",
"#F98C0AFF", "#FCAA0FFF", "#F9C932FF", "#F2E865FF", "#FCFFA4FF"
]
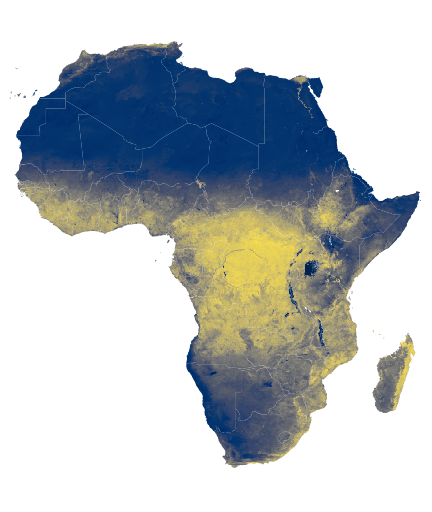
cividis = [
"#00204DFF", "#002C69FF", "#05366EFF", "#2D426CFF", "#414D6BFF", "#52596CFF",
"#61646FFF", "#6F7073FF", "#7C7B78FF", "#8B8779FF", "#9B9477FF", "#ACA174FF",
"#BCAF6FFF", "#CEBC68FF", "#E0CB5EFF", "#F2DA50FF", "#FFEA46FF"
]# # Closer to True color
visParams = {
'min': 0.0,
'max': 9000.0,
'dimensions': 512,
'region': region,
'opacity': 1,
'palette': natural
}url = ndvi.getThumbUrl(visParams)
Image(url=url, embed=True, format = 'png')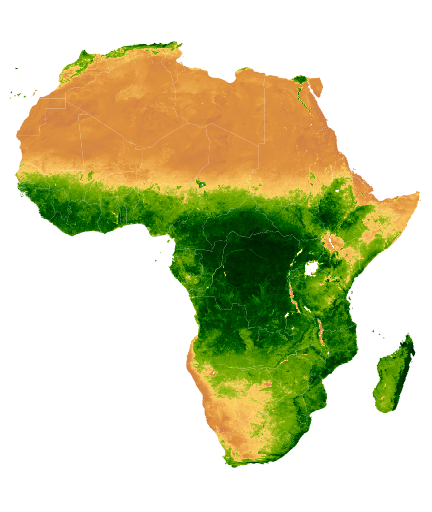
# # Viridis
visParams = {
  'min': 0.0,
  'max': 9000.0,
  'dimensions': 512,
  'region': region,
  'opacity': 1,
  'palette': viridis
}
url = ndvi.getThumbUrl(visParams)
Image(url=url, embed=True, format = 'png')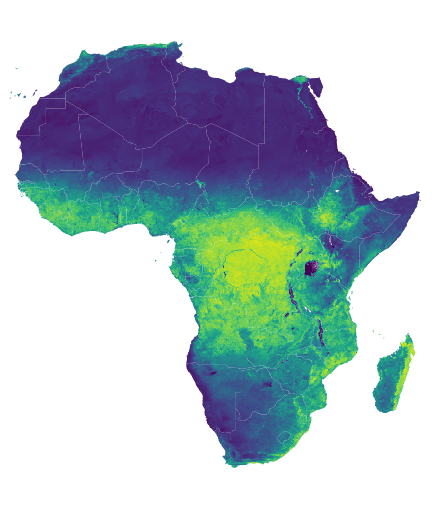
visParams = {
  'min': 0.0,
  'max': 9000.0,
  'dimensions': 512,
  'region': region,
  'opacity': 1,
  'palette': magma
}
url = ndvi.getThumbUrl(visParams)
Image(url=url, embed=True, format = 'png')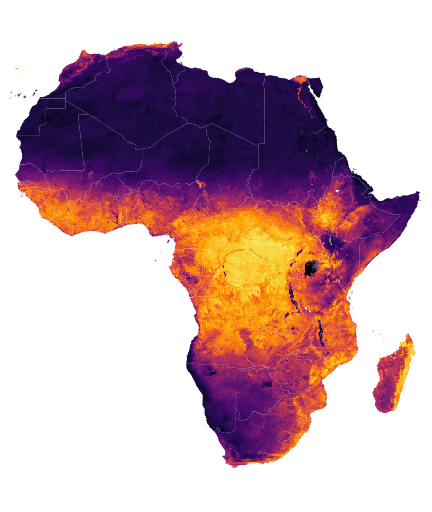
visParams = {
  'min': 0.0,
  'max': 9000.0,
  'dimensions': 512,
  'region': region,
  'opacity': 1,
  'palette': cividis
}
url = ndvi.getThumbUrl(visParams)
Image(url=url, embed=True, format = 'png')