Blog

Wrangling tidal flat data with R
Using R to explore and make use of large raster data can be challenging. This post provides some strategies for working with tiled raster data at a global scale at 30 meter resolution. The goal of this post is to demonstrate how to summarize this data to the country level.
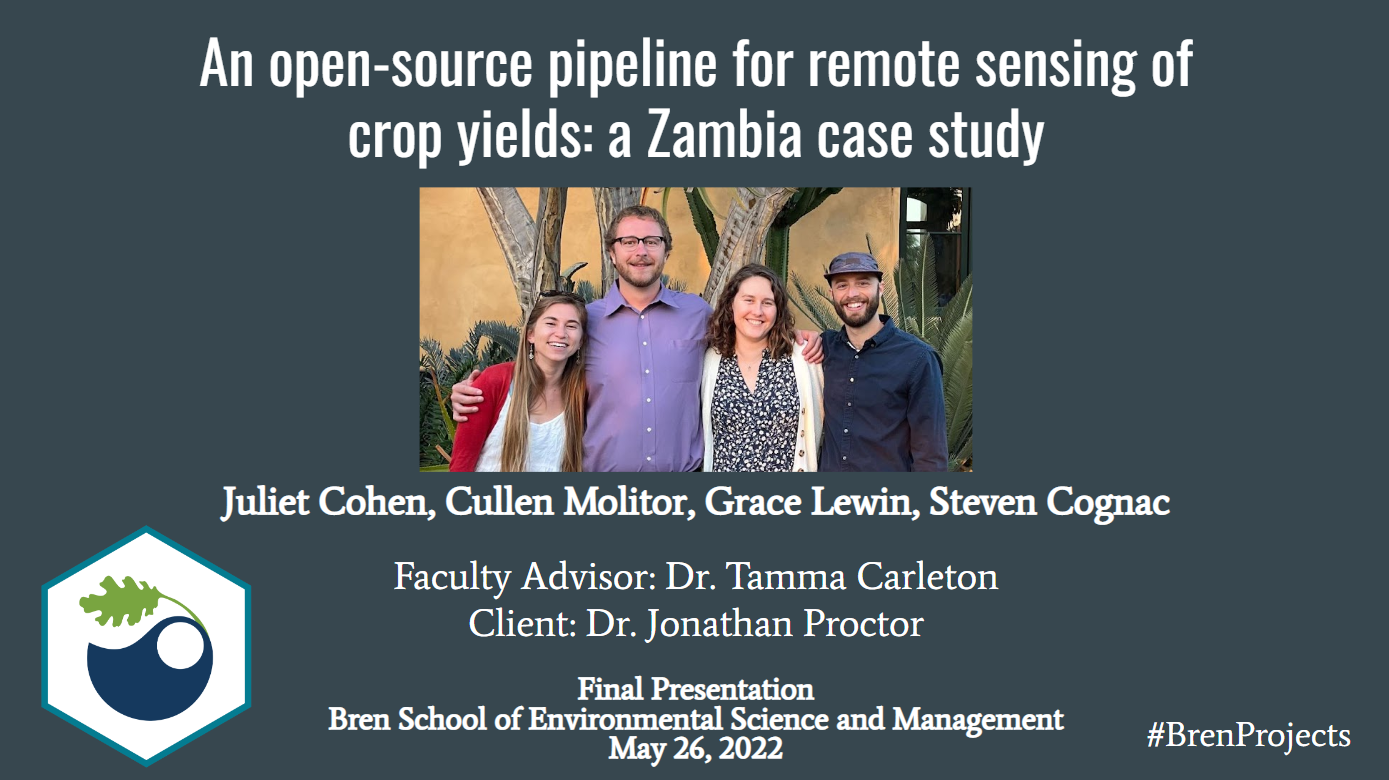
2022 MEDS Public Presentations
The Master of Environmental Data Science (MEDS) cohort present their final results of the capstone group projects. This post links to my groups presentation directly, but all groups are in the same YouTube link.
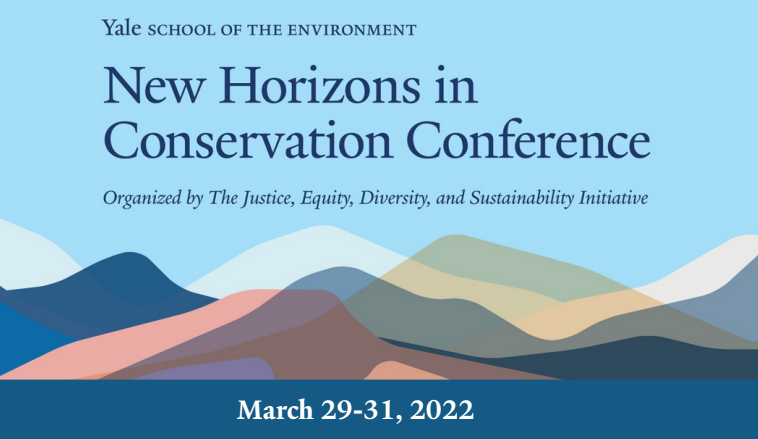
New Horizons in Conservation Conference Poster Submission
Our capstone group attended the New Horizons in Conservation Conference, 2022, organized through the Yale School of the Environments Justice, Equity, Diversity, and Sustainability Initiative. The 2022 conference was held virtually, and our group contributed a poster and video explaing our capstone project including our preliminary results.
CropMOSAIKS Animated NDVI
This notebook extends the code used to create the static images of the NDVI across Africa in 2013 for the MEDS capstone group CropMOSAIKS. This uses Google Earth Engine Python API to create an animated gif of NDVI over Africa from 2000 to 2021.
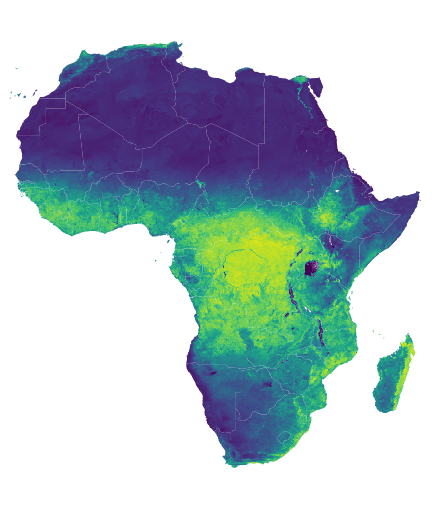
Creating Team Graphics
This notebook explores how the MEDS capstone group CropMOSAIKS used Google Earth Engine Python API to create static images of the median NDVI across Africa in 2013. The graphic are used in presentations for the group.
Channel Islands SST
This notebook explores how to plot satellite sea surface temerature (SST) in the Southern California Bight around the Northern Channel Islands. This shows how to plot a static plot as well as how to animate it over time.
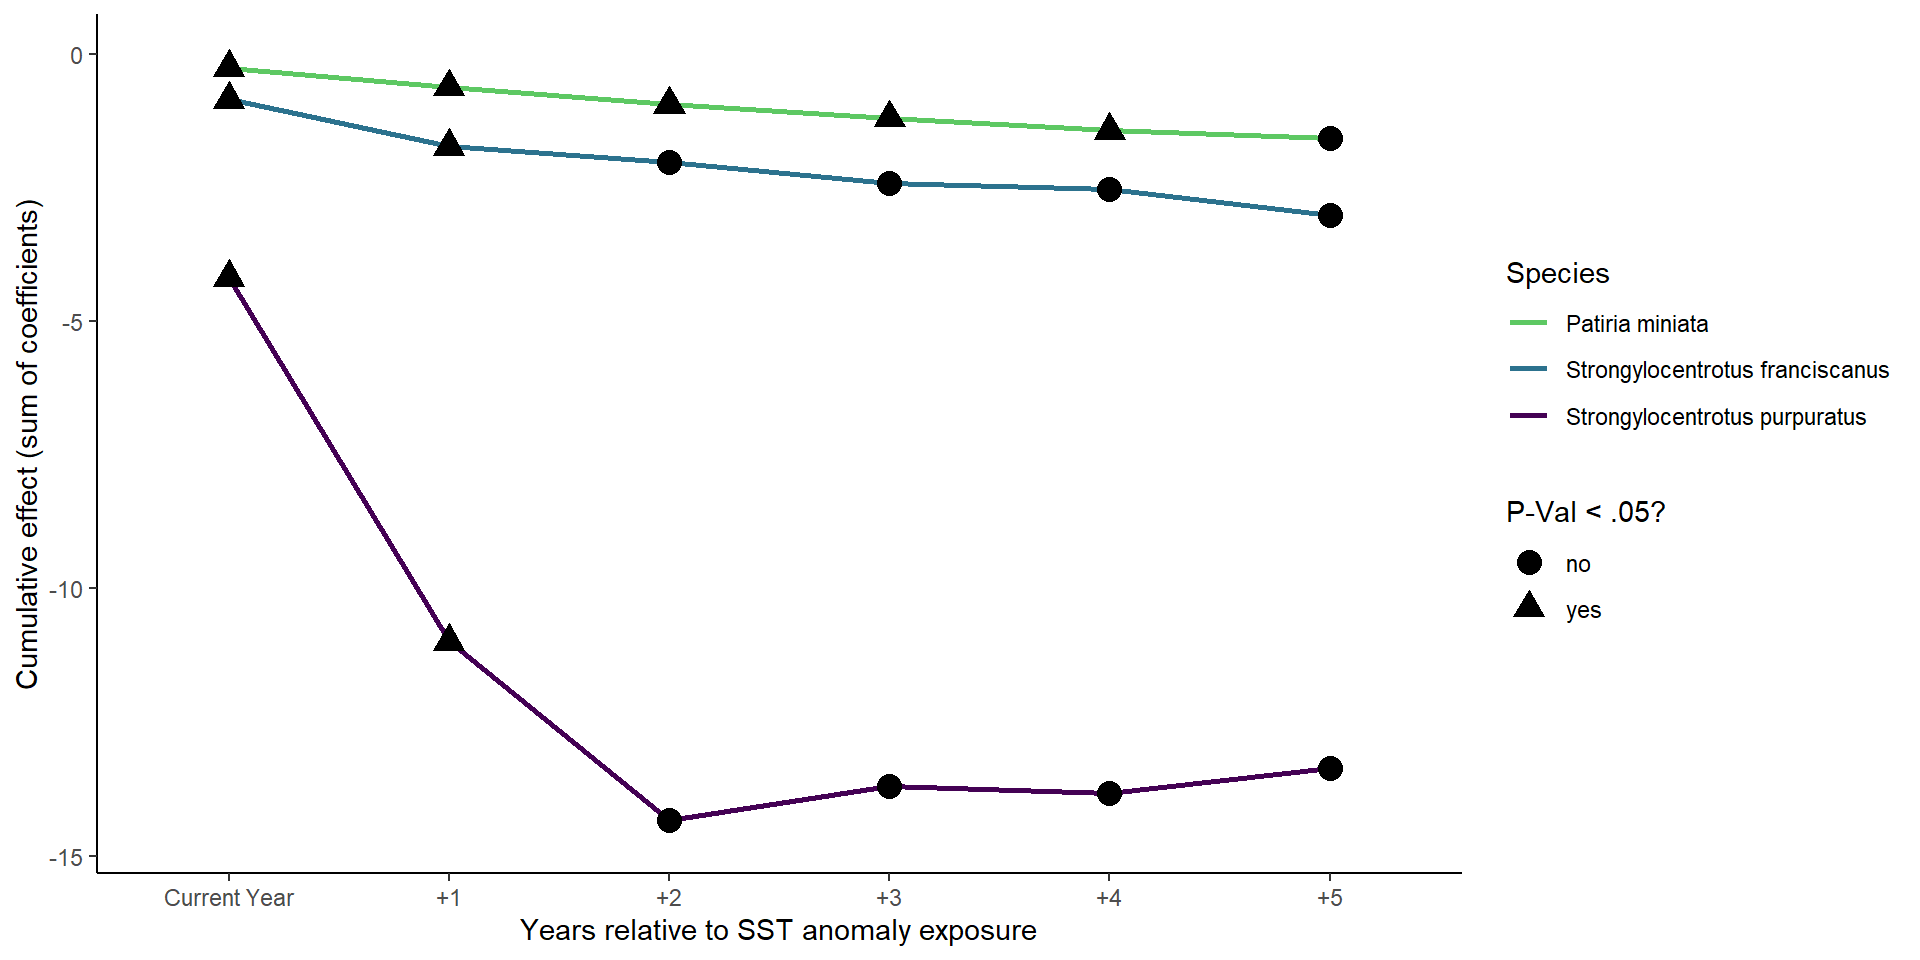
Effect of ENSO on Kelp Forest Species
This analysis takes a shotgun approach to investigate which species are sensitive to either warm-water or cold-water events by using a series of species-level dynamic linear models with lag SST anomalies as predictor variables. These models will provide a broad overview of which species are affected, how they are affected, and whether or not the affect is statistically significant. This will inform our understanding of how species distribution and population ranges might be affected by changing oceanographic conditions due to climate change.
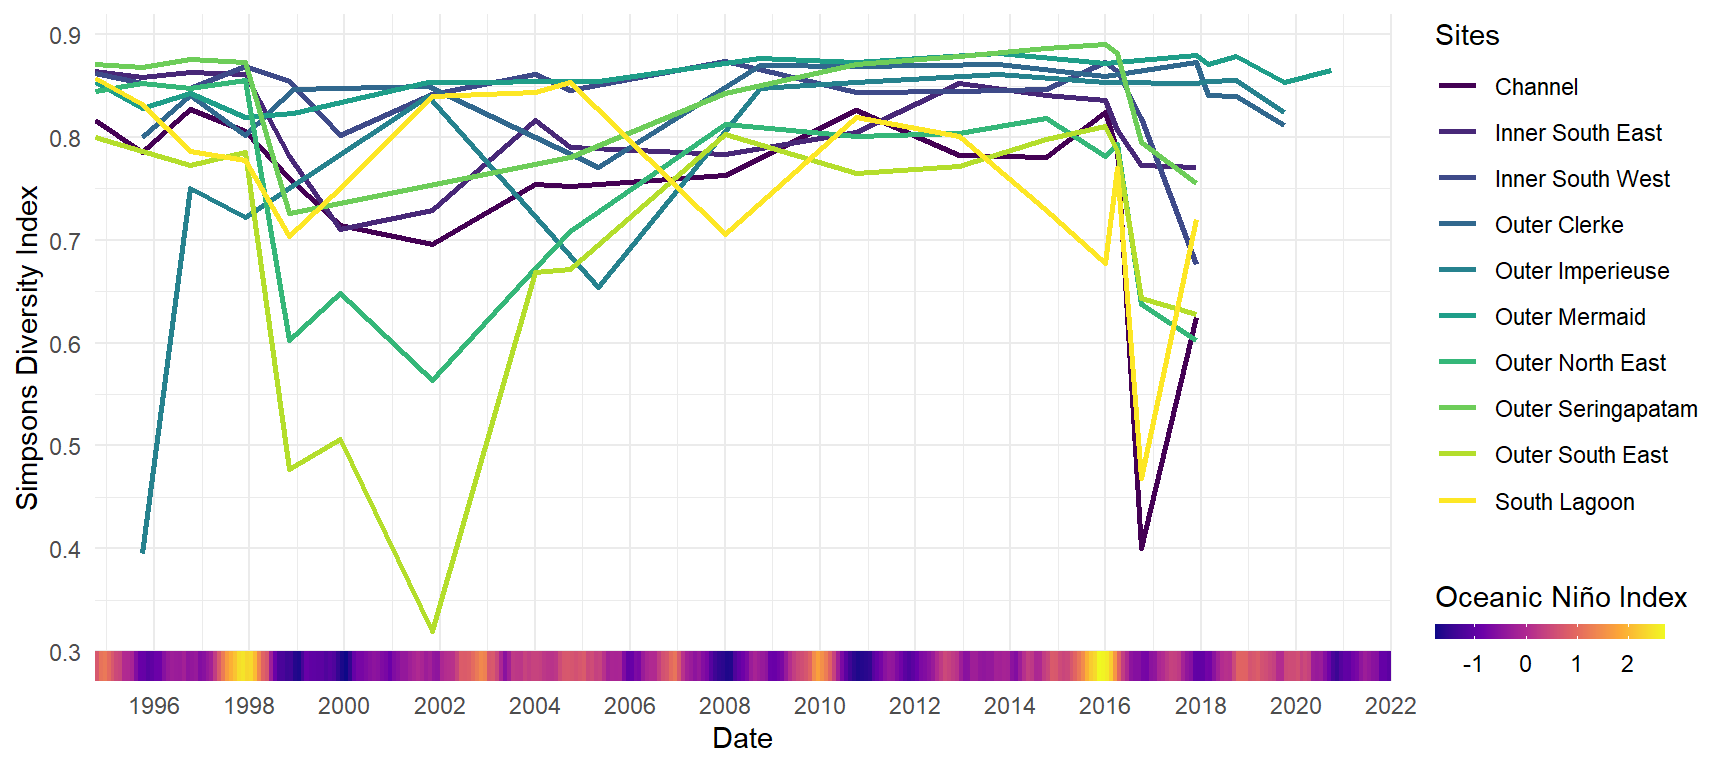
Effect of ENSO on Coral Reefs
"Our group discovered the Scott Reef and Rowley Shoals Coral Bleaching Data dataset while searching the DataOne repository for “coral bleaching.” This particular dataset focuses on long-term monitoring data from 1994 to 2017 at reef slope habitats off the coast of northwestern Australia."
Modeling ENSO and Wave Height
We are interested in investigating the effect of El Niño on our local oceanographic conditions. We used linear regression models to plot and compare equatorial sea surface temperature anomalies with local Santa Barbara temperature and wave height. Typically temperature anamolies are calcuated from a 30 year base period. Since we only had ~20 years of consistent data, we calculated monthly means since 1997 and used these as base values from which to compare monthly means for each year.
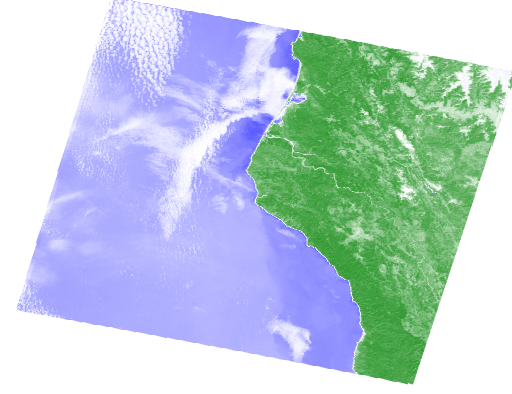
Remote Sensing with Google Earth Engine
Using Google Earth Engine to work with satellite imagery, We find the total precipitation for a coastal region in Northern Califnia as well as calculate the normalized difference vegetation index (NDVI), a simple graphical indicator that can be used to analyze remote sensing measurements. We use ERA5 Daily Aggregates data for precipitation and Landsat 8 data for NDVI.

Houston Blackout Analysis (2021)
This analysis will be based on remotely-sensed night lights data, acquired from the Visible Infrared Imaging Radiometer Suite (VIIRS) onboard the Suomi satellite.The task is to answer the questions: How many residential buildings were without power on 2021-02-16? Is there a socioeconomic metric that predicts being affected by the power outage?
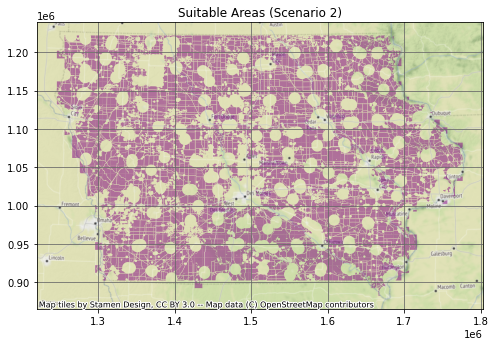
Iowa's Wind Power Potential
This analysis is used to determine locations in Iowa that would be suitible for wind turbine power plant installation as well as to calculate the hypothetical potential wind energy production capacity of these areas. This type of analysis can be used as a baseline in determining the maximum cost and benefits for potential renewable energy projects.
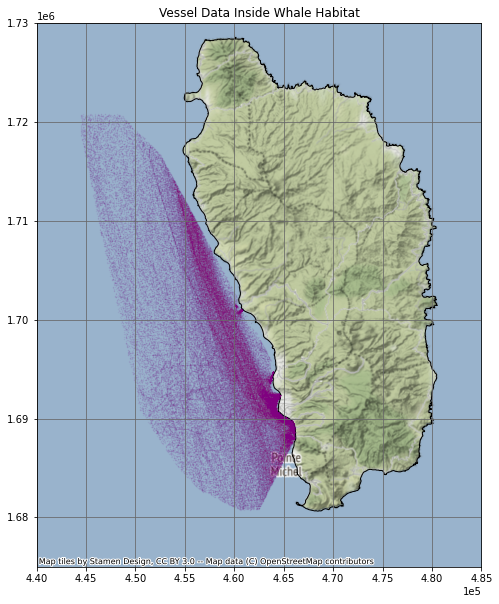
Protecting Whales From Ships
A vessel speed reduction zone is a potential solution to reducing ship strikes with whales near Dominica. The goal of this analysis is to look at sperm whale sighting data, and AIS vessel data, to determine a vessel speed reduction zone, and the effects implementing a vessel speed reduction zone would have on shipping activities in the zone.
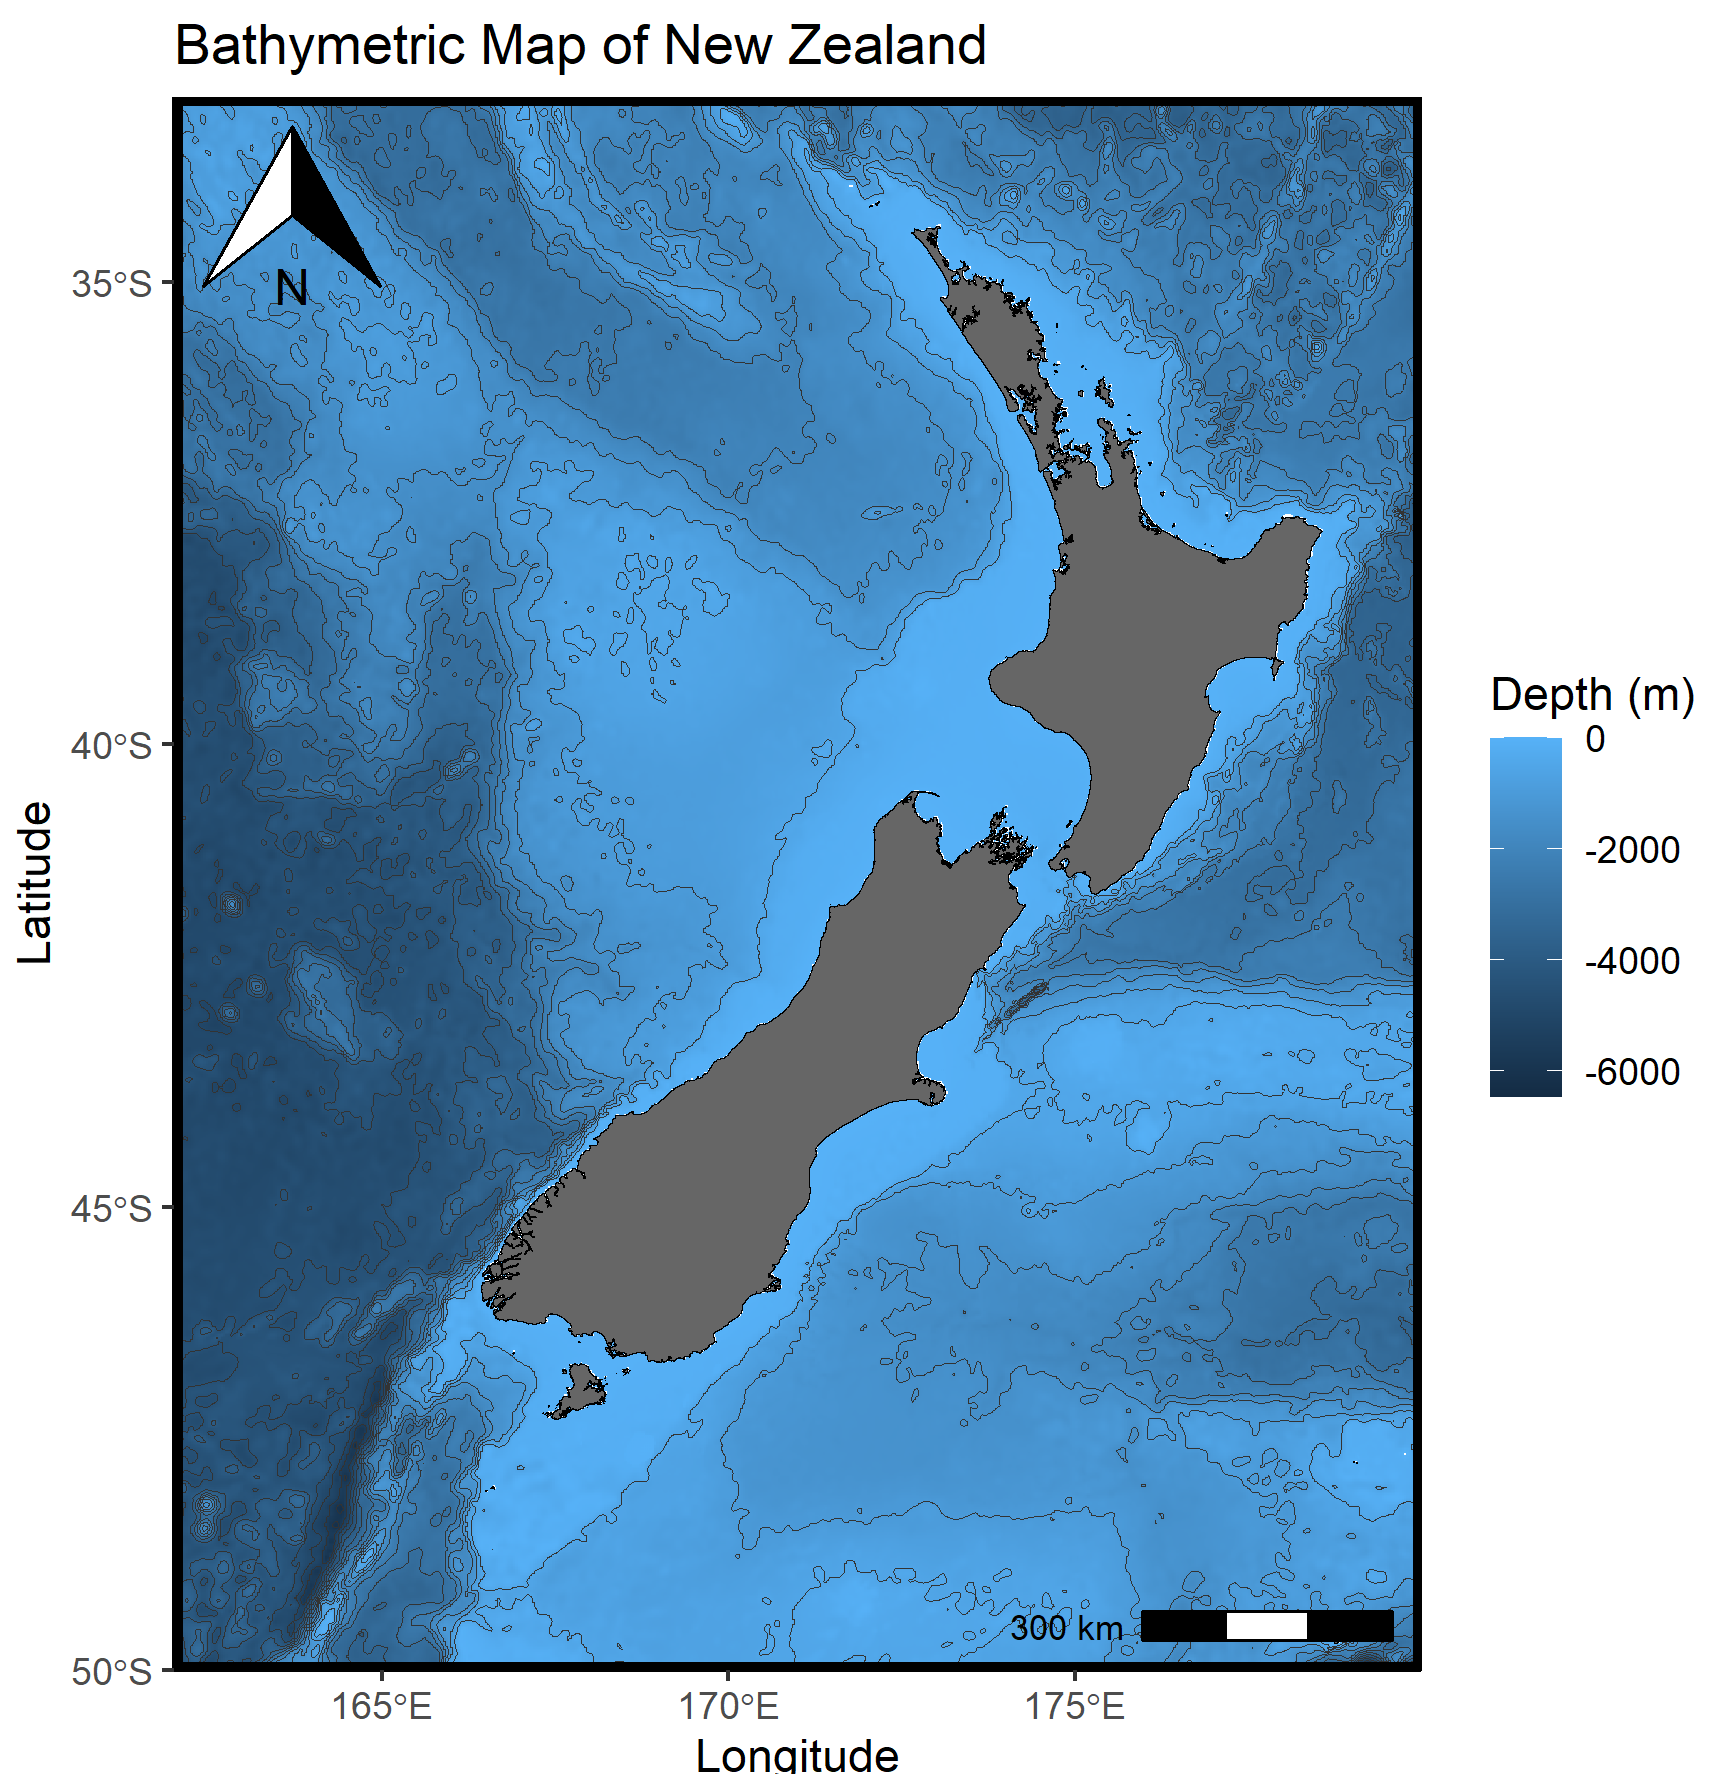
Cartography in R
Objectives: 1. Learn the (very) basics of map design 2. Learn how to load geospatial data 3. Learn how to inspect geospatial data 4. Plot geospatial data