2 What is MOSAIKS?
Multi-task Observation using SAtellite Imagery & Kitchen Sinks
2.1 The challenge
Right now, numerous public satellite systems collect huge amounts of data about the world every day. But there is so much imagery (terabytes per day) that it’s overwhelming to sort through by hand; and it’s too complex and unstructured to be usable in its raw form for most applications.
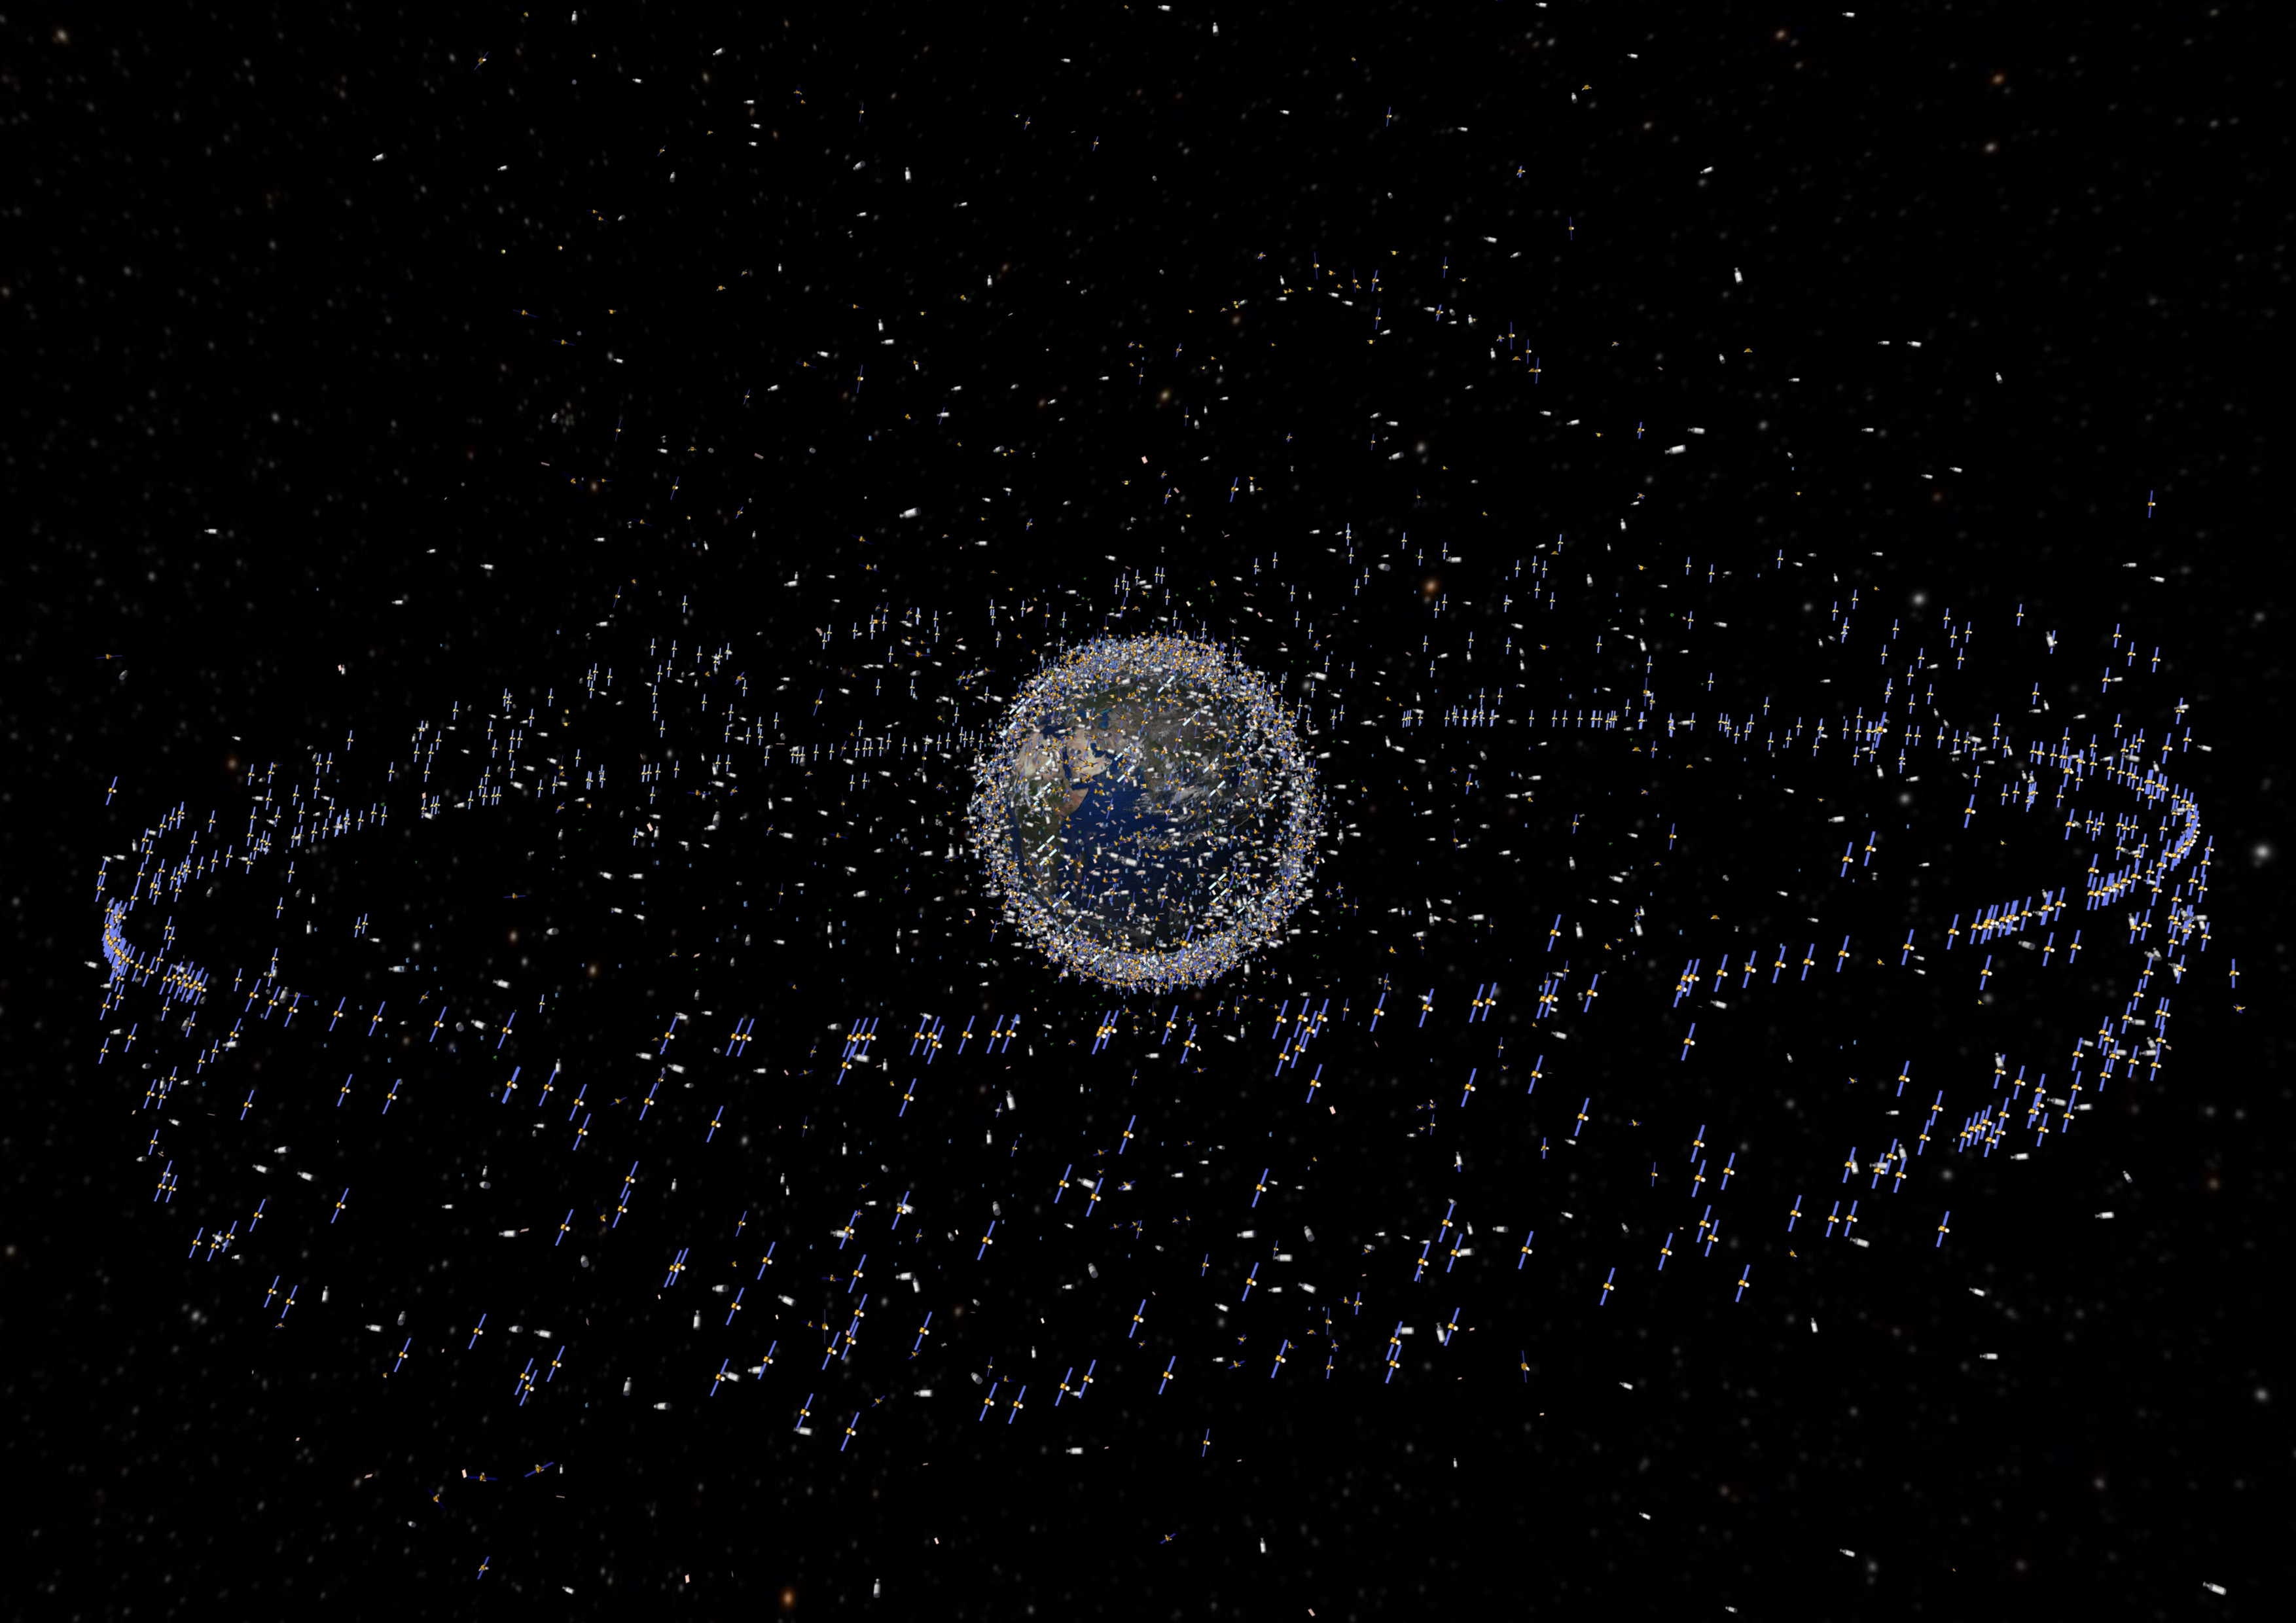
That is why linking satellite imaging to machine learning (sometimes referred to as SIML or SatML) is incredibly powerful. It enables vast amounts of unstructured image data to be transformed into structured information that can be used for planning, research, and decision-making.
Our hope is that people all over the world can access and use SIML technologies, but we recognize that many who would benefit from these tools don’t have the time or resources to manage enormous satellite imagery data sets and learn how to apply machine learning to them.
2.2 The solution
That’s why we developed MOSAIKS. MOSAIKS aims to lower the barriers to entry into SIML, diversifying the users of this powerful technology and the problems we solve with it.
MOSAIKS is designed to work “out of the box” for a wide array of SIML applications, for people with no SIML expertise who work on normal desktop or laptop computers. For many applications, MOSAIKS users never have to touch satellite imagery themselves and only need to have basic statistical training.
If you can run a regression, you can use MOSAIKS!
MOSAIKS empowers users to create their own new datasets from satellite imagery. We don’t control what variables users look at, and we never need to know. MOSAIKS is a system that allows users to quickly transform vast amounts of imagery into maps of new variables, using their own training data.
If you’ve ever been curious about trying machine learning with satellite imagery, but don’t know anything about machine learning or satellite imagery, MOSAIKS is for you.
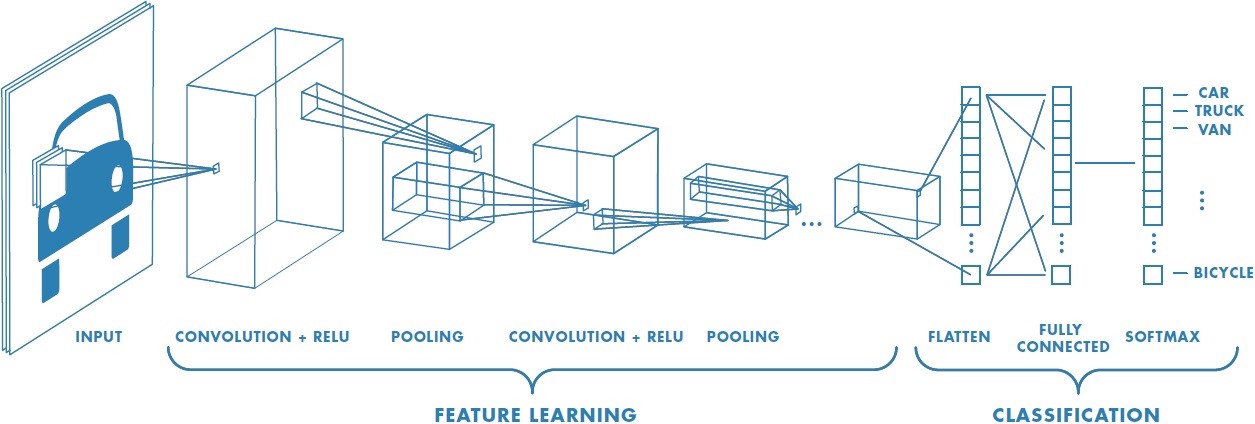
And if you know a lot about machine learning and satellite imagery, MOSAIKS might still be for you, since it performs competitively with deep learning methods but is much simpler and cheaper to use.
2.3 How MOSAIKS works
2.3.1 Separating users from imagery
The basic idea of MOSAIKS is to separate users from the costly and difficult process of transforming imagery into inputs (called “features”) to a downstream machine learning algorithm (images → X). The MOSAIKS team has computed these features globally, so in many use cases users never have to download or manage imagery themselves. Instead, users download a table of MOSAIKS features (X), link them to their own geocoded data on the outcome (Y) they are interested in predicting from satellite imagery (we call these data “labels”), and then run a linear regression (or something fancier if desired!) to predict their labels using MOSAIKS features (Y = Xβ). Importantly, this prediction can be performed in locations, time periods, and at spatial resolutions for which labels are not available.

2.3.2 Generalizability of MOSAIKS
Because MOSAIKS features synthesize information contained in raw imagery that is not tailored for any specific outcome (e.g., biodiversity, household income, land use), many users can use the same MOSAIKS features and simply match them to their own labels based on location. Users can run their analysis on any statistical software they are comfortable with. For most applications, the computing demands will not require users to work with specialized machines, since desktops and laptops work.
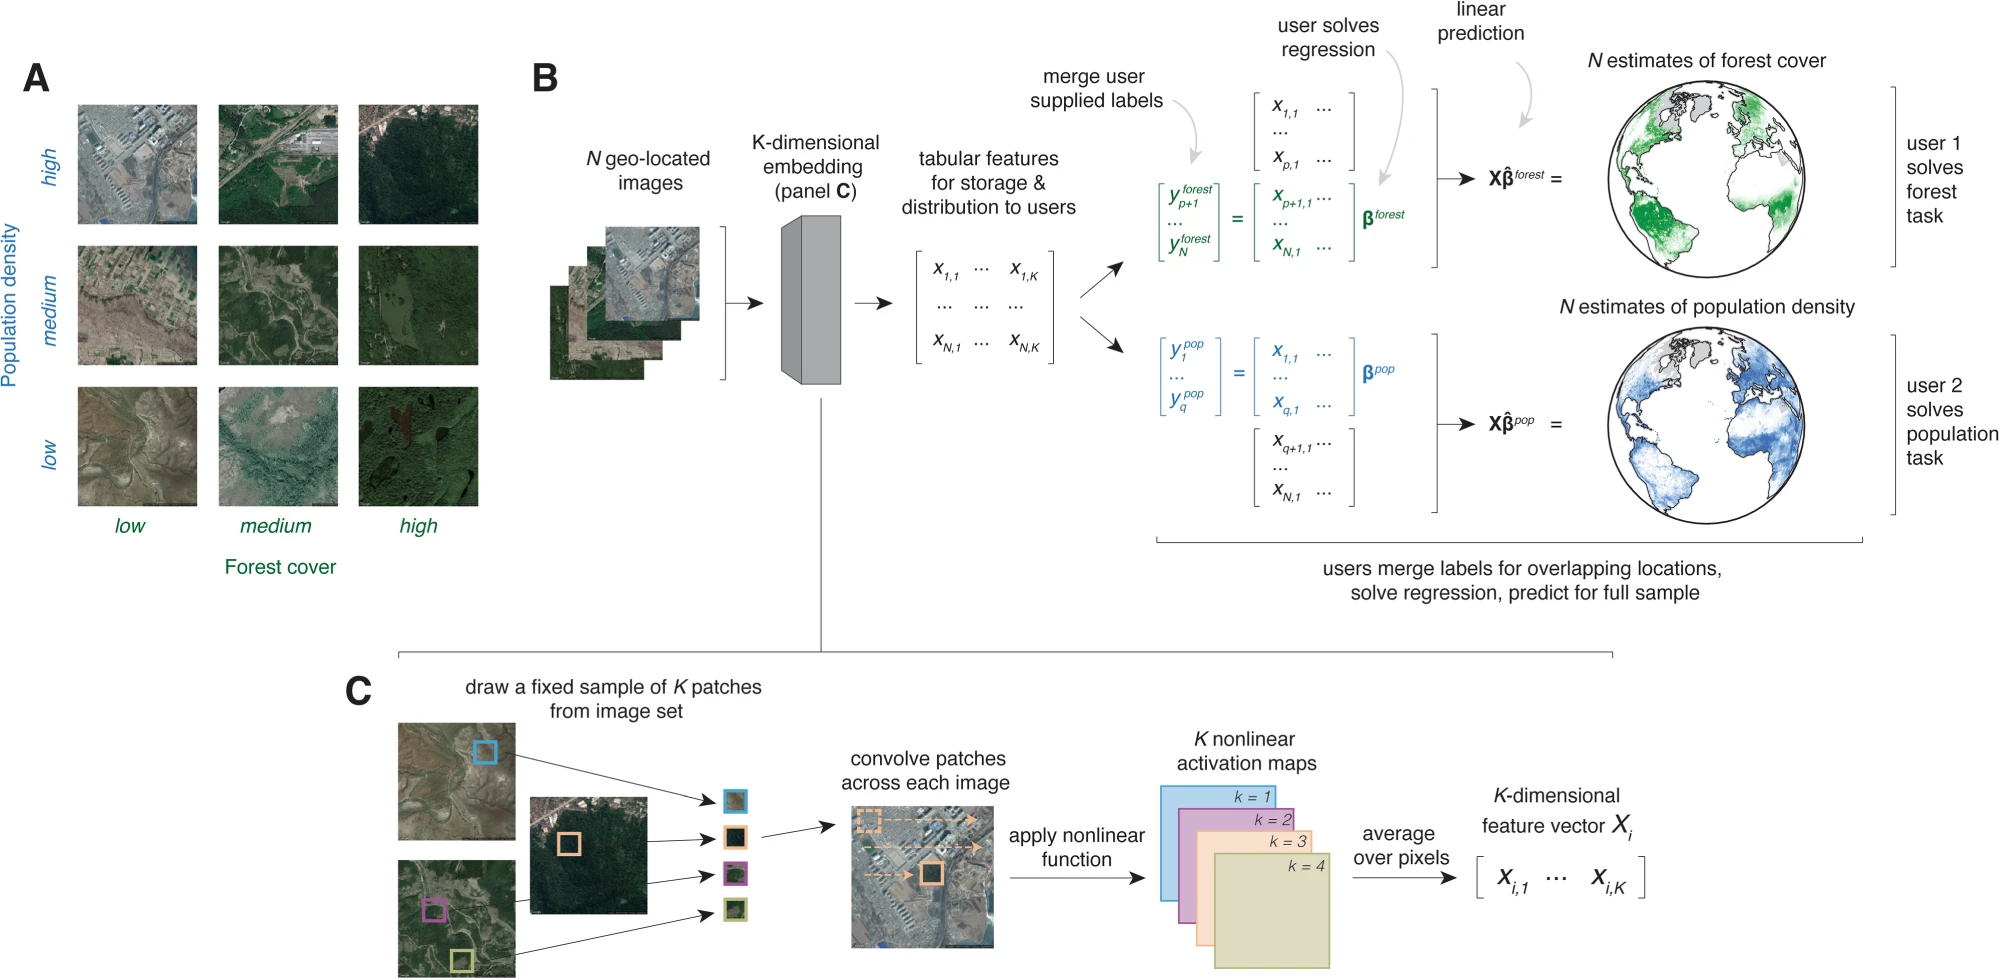
2.3.3 Why it works
MOSAIKS works because MOSAIKS features capture a huge amount of information about the colors, patterns and textures that show up in satellite imagery. We don’t know what patterns/colors/textures will be important for the application that users have (since we don’t know what applications users will try), so we just try to capture all of them. The purpose of the regression step is to teach the model which patterns/colors/textures predict the labels, and then to use that understanding to make predictions in locations where users don’t have labels. In addition, MOSAIKS encodes image information in a way that allows for nonlinear relationships between labels and imagery data, even though the regression that users generally implement is a linear regression.
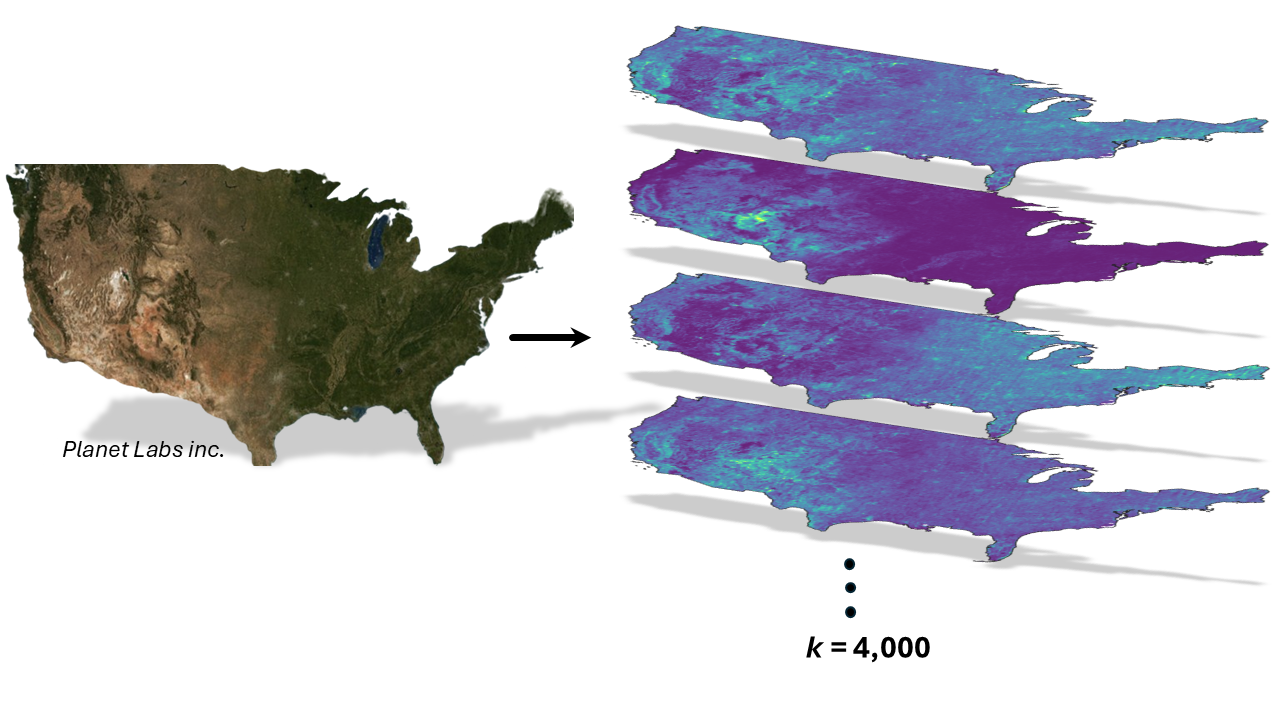
For learn more about these features, see Chapter 12 where we attempt to provide intuition for what a feature is and how it is made.
2.3.4 Five steps to using MOSAIKS
This section is a very broad overview of the steps to use MOSAIKS. Later chapters will provide more detailed guidance on each step.
In many cases, users aiming to predict an outcome from satellite imagery can do so using pre-computed imagery features (X) in a simple linear regression framework. Later in this training course, we will detail more customized workflows that remain tractable but allow for more flexibility. In the standard case, however, the procedure for using MOSAIKS has five steps (corresponding figure from Rolf et al. is below):
Download pre-computed MOSAIKS features (X) corresponding to the locations where you have labels (Chapter 3).
Merge the features with your labels (Y) based on location (so features at position P are linked to labels at position P) (Chapter 7).
Run a cross-validated ridge regression of your labels on the MOSAIKS features (Y = Xβ + e; or any other model you choose! See ?sec-sec-model-choice).
Evaluate performance.
Use the results of the regression model (β) to make predictions (Xβ) in a new region of interest where you do not have labels, using only the MOSAIKS features (X) that correspond with those new locations.
2.4 What can MOSAIKS predict?
This question is answered in greater detail in Chapter 5
MOSAIKS has been successfully used to predict a wide range of outcomes including:
- Environmental conditions (forest cover, elevation)
- Population patterns (density, nighttime lights)
- Economic indicators (income, house prices)
- Infrastructure (road networks)
The figure below is from the original MOSAIKS publication (Rolf et al. 2021). The left maps show the input labels. The right map shows the modeled predictions. The scatter plot shows the modeled predictions against the true labels and reports the coefficient of determination (R²) as a measure of performance.
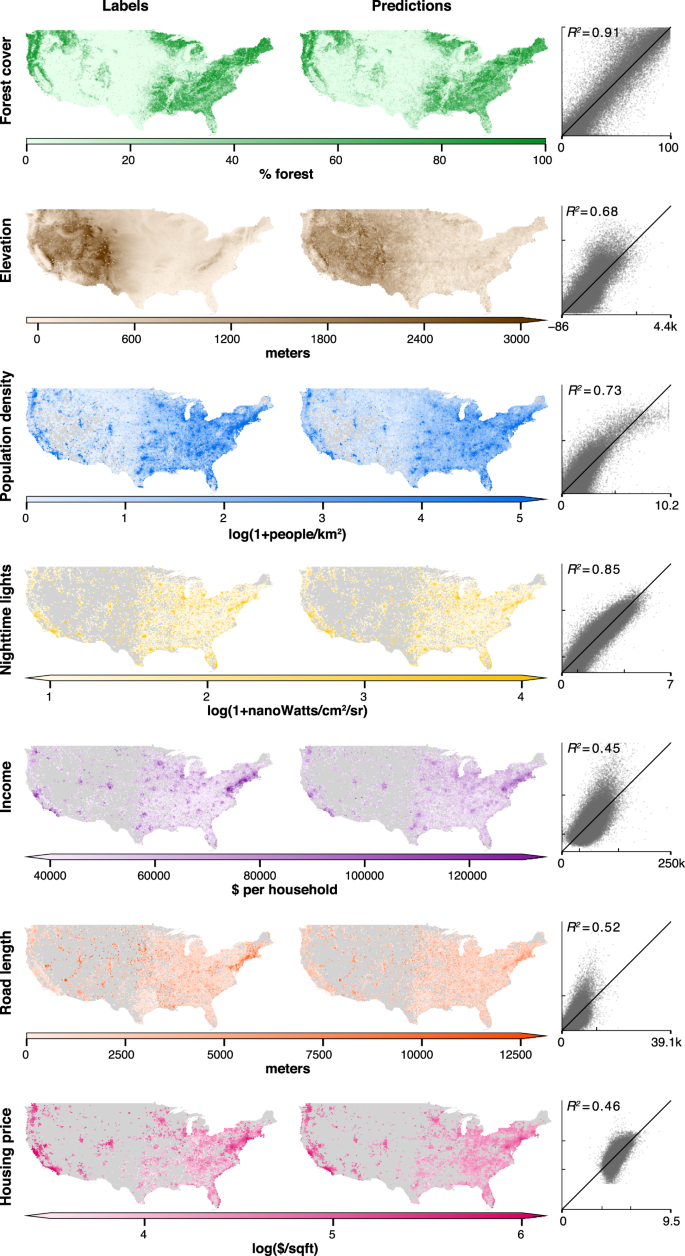
Importantly, all these predictions use the same set of satellite features - there’s no need to reprocess the imagery for different tasks. MOSAIKS achieves accuracy comparable to more complex deep learning methods, but at a fraction of the computational cost. This is the power of MOSAIKS, it removes the need for reprocessing the imagery after the initial encoding.
2.5 Is MOSAIKS always the best choice?
No! MOSAIKS is a powerful tool, but it is not always the best choice for every application. In fact, it is usually not the “best” choice for any application. We aim to be competitive with leading models, so the true benefit of MOSAIKS is in its simplicity, accessibility, and scalability for the average user.
We recommend that you start by searching for existing methods developed for your application, before investing time and resources into MOSAIKS. An excellent place to begin this search is at satellite-image-deep-learning where you can find a list of deep learning methods that have been developed for satellite imagery, as well as existing datasets, tools, and tutorials.
The world of SIML is vast and rapidly evolving. This means there is a good choice you do not have to make global scale predictions yourself. Instead, you might be able to use or build off the hard work of many others in the field.
If you have a specific context where you want tailored information or a variable/outcome no one else has predicted before, then you want MOSAIKS. Not only will MOSAIKS allow you to make predictions in a new context, but it will also allow you to do so quickly and with minimal computational resources.
2.6 Lecture materials
TODO: Add recorded lecture here.
2.7 Summary
MOSAIKS is a powerful tool that allows users to predict a wide range of outcomes from satellite imagery using pre-computed features. The system is designed to be accessible to users with no prior experience in machine learning or satellite imagery. The MOSAIKS framework involves five simple steps
Download features
Merge with labels
run a regression
Evaluate performance
Make predictions
In this book we will explore all the ways in which this is an oversimplification. You will learn to adapt this framework to your own needs, and to understand the limitations and assumptions of the MOSAIKS system. Many skills presented in this training manual will be applicable to other satellite imagery and machine learning workflows.
In the next chapter, you will be introduced to the MOSAIKS API which is a free and open resource for accessing pre-computed MOSAIKS features.